The Model Said Strong. The Transaction Wire Said Otherwise.
At some point this morning a line went up on the New York Yankees transaction log: activated LHP Max Fried from the 15-day injured list. Eleven words. By the time our board finished running a few hours later, Max Fried Over 3.5 strikeouts was the loudest number on it, a strong play at a 4.7 point edge, the best thing the model had seen all day. Both of those things were true at once, and only one of them mattered.
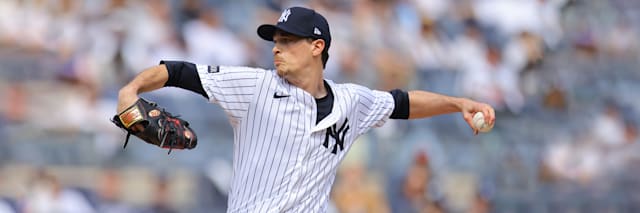
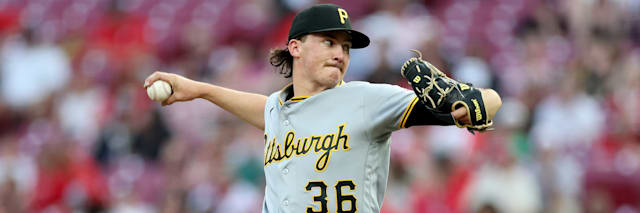
Eleven Words That Beat A Statcast Model
Here is the full trail, in order. On May 16 the Yankees placed Fried on the 15-day injured list with a left elbow bone bruise, retroactive to May 14. His last major league appearance had come three days before that: 3.0 innings, two strikeouts, 61 pitches, an early walk to the dugout that reads differently now than it did then. On July 17 he was sent to Scranton and Wilkes-Barre on a rehab assignment and threw 3.0 innings on 52 pitches, facing 14 hitters and striking out three. This morning, five days after that outing, the Yankees activated him.
So tonight is his first major league start in 70 days.
Our model did not know any of that, and it is important to say clearly that this is not a bug. The model reads game logs, rate statistics and Statcast inputs. It does not read the transaction wire. When it looked up Max Fried it found a pitcher with a 3.21 earned run average, a 1.01 WHIP, 50 strikeouts in 61.2 innings across 10 starts, and a most recent entry that looked like a normal start by a good pitcher. Everything it saw was accurate. The thing that mattered was not in the file.
Where The Edge Actually Lived
A strikeout prop is two bets stapled together. One is a bet on rate, how often this pitcher turns a hitter into an out by strikeout. The other is a bet on volume, how many hitters he gets to face. Handicappers spend most of their attention on the first and lose most of their money on the second.
Fried's rate is easy and it is not in dispute: 50 strikeouts in 240 batters faced this season, 20.8 percent. Pittsburgh helps, striking out in 24.2 percent of its plate appearances, fourth most in baseball against a league mark near 22.3 percent. Adjust his rate for that lineup and you land around 22.6 percent per batter. Fine. That number is defensible and I will defend it.
Now the volume, which is where the whole argument lives. Take that 22.6 percent, run it across a normal Fried start of 24 batters, and the chance of reaching four strikeouts comes out at 79.0 percent. Look at what the board said: 74.0 percent, after blending toward the market. The two numbers are the same number. Which tells you exactly what assumption the model made without ever announcing it.
Then move the dial.
Seven batters is the whole disagreement. Fried has averaged 3.82 pitches per batter this season, so a 75-pitch evening buys him roughly 19 or 20 hitters and an 80-pitch evening buys him 21. He threw 52 pitches in his only rehab outing five days ago. Clubs do not usually double a rehab pitch count in one step, and the Yankees have a division to protect and an elbow they have already spent ten weeks protecting.
Could he go six and strike out seven? Yes. Genuinely, yes. Fried struck out nine Red Sox on April 22 and he was the best pitcher on this staff before the injury. If he throws 95 pitches tonight and finishes with seven punchouts, nothing written here was wrong. The claim here is narrow and I want it stated precisely: at -158 you are being asked to pay for 61.2 percent certainty, and the honest range on his workload delivers something between 53.5 and 66.1 percent. The price sits inside our own error bars. You do not get paid for being inside your error bars.
The Book Is Telling You The Same Thing, Out Loud
The most useful thing on a night like this is not a model at all. It is watching what a sportsbook refuses to do.
FanDuel put Fried's strikeout line at 3.5. On a 16-pitcher board that is the floor tier, shared with Keider Montero, Martin Perez, Eduardo Rivera, Bailey Ober, Slade Cecconi and Eric Lauer, while Aaron Nola, Kyle Bradish and Peter Lambert all sit up at 5.5. A pitcher with a 3.21 earned run average and a 1.01 WHIP is being priced in the same strikeout neighborhood as replacement-level innings eaters. His own 2026 rate of 5.0 strikeouts per start sits a full strikeout and a half above the number he was given.
Then look at what is missing. FanDuel posted an Outs Recorded market for nine starting pitchers on this slate. Kay, Rea, King, Bradish, Cecconi, Nola, Lauer, Lambert, Alcantara. It posted none for Max Fried. A book pulls a workload market when it does not know the workload, and when a book with a full risk desk and a direct line to beat reporters declines to price how many outs a man will record, that is not caution you should be trading against.
The alternate ladder tells the same story with a different accent. Fried's runs 3 or more at -440, 4 or more at -158, 5 or more at +134, 6 or more at +300, and stops at 7 or more at +630. Chandler's, on the other side of the same game, runs all the way out to 8 or more. And then there is the detail that made me stop reading and start writing: FanDuel is offering Fried's first pitch at 91.9 miles per hour or slower at -160, making a soft opening fastball the odds-on outcome, with the 94 and above bucket way out at +650. The book is not being coy about what it expects to see from a pitcher whose elbow was in a boot in May.
| What FanDuel did | What it usually does | Read |
|---|---|---|
| Fried strikeout line at 3.5 | 5.5 tier for starters of his quality tonight | Workload suppressed |
| No Outs Recorded market for Fried | Posted one for 9 other starters today | Book will not price his length |
| Alt ladder capped at 7 or more | Chandler's ladder runs to 8 or more | Ceiling trimmed |
| First pitch 91.9 mph or slower at -160 | 94 and above priced at +650 | Diminished stuff expected |
| Over 3.5 at -158, Under at +124 | Roughly 5.9 percent hold on the pair | Wide two-way price |
Model, Market And Us, Side By Side
Chandler Gets Cut On His Own Numbers
The board's second flagged play was Bubba Chandler Over 4.5 strikeouts at -140, tagged a lean at a 2.6 point edge. This one does not need a transaction wire to fall over. It just needs his game log.
Chandler has struck out 85 hitters in 421 batters faced over 19 appearances, a 20.2 percent rate across 22.2 batters per outing. Give him the Yankees, who strike out in 24.1 percent of their plate appearances, fifth most in the sport, and the adjusted estimate comes to roughly 53 percent to reach five strikeouts. The price needs 58.3 percent. And his actual record is bleaker than the projection: he has reached five strikeouts in 9 of 19 outings, 47.4 percent, with a distribution that swings from an 11-strikeout night in Toronto to a start against Washington on July 5 where he recorded none at all.
Regular readers may recognize the name. This page cut Bubba Chandler yesterday, on July 21, for the identical reason. A filter that only fires when it produces a convenient answer is not a filter, and applying it twice in two days against a model that liked him twice is the only thing that makes yesterday's cut mean anything.
| Play | Price | Model | Price needs | Our read | Verdict |
|---|---|---|---|---|---|
| Max Fried Over 3.5 K, Yankees vs Pirates | -158 | 74.0% | 61.2% | 53.5% to 66.1%, workload unknown | PASS |
| Bubba Chandler Over 4.5 K, Pirates at Yankees | -140 | 66.7% | 58.3% | 53%, and 47.4% by his own log | CUT |
| Slade Cecconi Under 3.5 K, Twins at Guardians | +122 | 50.5% | 45.0% | Graded no bet by the board itself | NO BET |
| Martin Perez Over 3.5 K, Padres at Braves | +100 | 54.7% | 50.0% | Under one point of edge | NO BET |
| Every outs recorded contract on the slate | varies | varies | varies | All graded negative | NO BET |
The Rule This Costs Us Money To Keep
There is a version of this evening where we write up the Fried over, it lands on four strikeouts in the fourth inning, and nobody ever asks how we got there. Passing is not free. It costs a winner roughly as often as it saves a loser, and the only thing that makes it worth doing is that the reasoning stays the same on both kinds of night.
The rule is this. A projection is a claim about a rate multiplied by a claim about volume, and the volume claim is usually the one nobody checked. Before a strikeout number goes on this page it has to survive one question: does this pitcher actually get to face the number of hitters this projection quietly assumed? For relief-eligible swingmen the answer is usually no, which is why we cut three of them yesterday. For a pitcher activated off the injured list on the morning of his start, the answer is emphatically no, and the market has already repriced everything except the model's opinion.
Everything on this page is analysis only. There is no tracked pick for July 22 and no units are staked, so the season record is untouched. Two contracts were flagged playable by the model and both were cut on review. The rest of the board graded no bet on its own terms.
Final Verdict
No play. The best number on the July 22 board belonged to a pitcher who was on the injured list when the sun came up, and the 4.7 point edge attached to it was an artifact of a workload assumption rather than a disagreement with the market. Strip the assumption out and the edge goes with it. FanDuel, which has better information about Max Fried's pitch count tonight than any public model does, responded by cutting his line to the board's floor, refusing to price his outs at all, and making a slow first fastball the favorite. When the book declines to take a position on a pitcher's length, that is not an invitation.
Chandler is a simpler no. His own 19 outings say 47.4 percent against a price demanding 58.3, and no adjustment closes that.
Back tomorrow with a full slate and, one hopes, a board that survives its own filter.
Frequently Asked Questions
Because the projection assumes a workload he will not receive. Fried was activated off the 15-day injured list on the morning of this start after a left elbow bone bruise that cost him 70 days, and his only rehab outing was 3.0 innings on 52 pitches five days earlier. The model priced him at 74.0 percent to clear the number, which is what his rate produces across a full 24-batter start. Against a realistic 17 to 20 batters the same arithmetic returns 53.5 to 66.1 percent, and the price at -158 needs 61.2 percent. The edge lives entirely inside a pitch limit that cannot be verified, so it gets cut rather than hedged.
Nothing about the rate, everything about the volume. Its 20.8 percent strikeout rate for Fried, built from 50 strikeouts in 240 batters faced, is correct. It then applied that rate to a normal start length, because a model reads game logs and a game log does not contain a transaction. Run his matchup-adjusted rate over 24 batters and you get 79.0 percent, which reproduces the board's number almost exactly. The rate was never the problem.
A great deal, all of it cautious. His strikeout line sits at 3.5, the floor tier of a 16-pitcher board, alongside Montero, Perez and Lauer while Nola, Bradish and Lambert sit at 5.5. The book posted no Outs Recorded market for him at all despite posting one for nine other starters. His alternate ladder stops at 7 or more. And his first pitch is priced at 91.9 miles per hour or slower at -160, with 94 and above at +650.
On his own numbers. Chandler has 85 strikeouts in 421 batters faced across 19 appearances, a 20.2 percent rate over 22.2 batters per outing, and he has reached five strikeouts in 9 of those 19 trips, a 47.4 percent record. Adjusting for a Yankees lineup that strikes out in 24.1 percent of its plate appearances lifts the estimate to roughly 53 percent. The Over 4.5 at -140 needs 58.3 percent. This page cut him on the same grounds one day earlier.
No, it means the model is one input. This one flagged two contracts out of a full slate and both failed review, which is a normal outcome and a healthy one. A board that produces a play every single day is a board that has stopped filtering, and the days it cannot find anything are the days its filter is doing the most work.