Twenty Seven Hitters, Once In Seven Starts.
Patrick Sandoval has struck out 35 of the 160 hitters he has faced since his first appearance of the season on July 9, a rate of 21.9 percent. Run that rate backward and a sixth strikeout arrives somewhere around the twenty seventh batter of the night. He has faced twenty seven batters in a game exactly once in seven starts, on August 11 in Toronto, and he struck out four that day. The under 5.5 is posted at even money, and the whole contract is an argument about volume rather than about swing and miss.
Largest edge
Sandoval u5.5 K, +100
Break-even
50.0%
Game log rate
5 of 7 starts, 71.4%
Strikeouts per start
5.0 on the season
Playable contracts
7 of 55, all strikeouts
Outs board
27 contracts, 0 playable
Seven Contracts Out Of Fifty Five
Fifty five contracts were priced and evaluated across all fifteen games on the August 22 slate. Twenty eight of them were strikeout markets and twenty seven were pitcher outs markets. Seven graded playable and every single one is a strikeout contract, which is unusual enough to say out loud rather than bury: the outs engine did not produce one actionable number today. Four contracts graded strong and three graded lean. Everything else is documented below with the figure that ended it.
The headline is Patrick Sandoval under 5.5 strikeouts at even money, San Francisco Giants at Boston Red Sox, 7:15 PM ET at Fenway Park, opposite Blade Tidwell. Even money needs exactly 50.0 percent to break even. The blended model number lands at 58.1 percent while the de-vigged market has the under at only 47.1 percent, and that disagreement is what produced the largest edge on the board at plus 8.12 percentage points.
The Arithmetic Nobody Wants To Do
Sandoval's first appearance of the 2026 season came on July 9 in Chicago. Since then he has made seven starts, thrown 34.0 innings, faced 160 hitters and struck out 35 of them. That works out to 21.9 percent of the batters he sees, a 9.26 per nine rate, and exactly 5.0 strikeouts per start. His season high is seven, set on July 29 at the Athletics. He has never reached eight.
Turn the rate into a requirement. At 21.9 percent, a sixth strikeout arrives at roughly the twenty seventh batter faced. Sandoval's batters faced by start read 19, 23, 22, 22, 23, 27 and 24, so he has crossed that threshold once and only barely, on August 11 in Toronto when he threw six innings and struck out four. His per start average is 22.9 hitters. To go over this number he has to either work deeper than he has worked all season or miss bats at a rate he has not shown since coming back.
That clustering is the part a buyer of this under has to accept. Four of the seven starts finished on exactly five strikeouts, one short of a loss. There is no comfortable cushion here, only a rate and a volume ceiling that both point the same direction. A 71.4 percent log against a 50.0 percent price is a real edge and still a lean, never a lock.
Six Pitches, And Nothing That Reads As A Put-Away Pitch
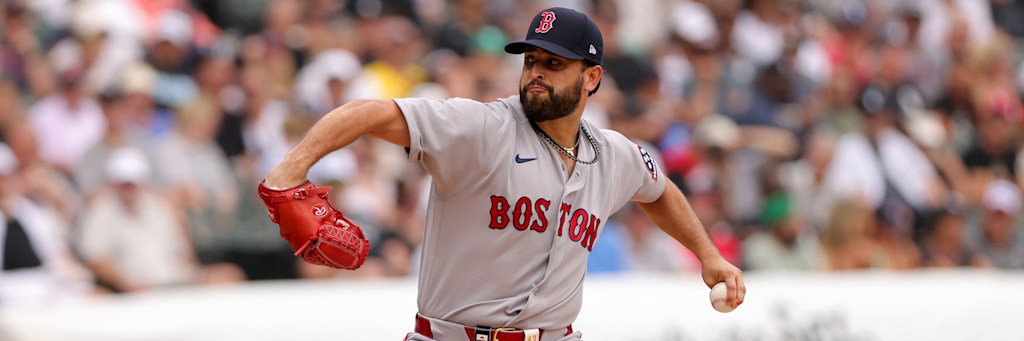
Sandoval has thrown 579 pitches in 2026 and they split six ways. The slider leads at 27.6 percent and averages 86.8 miles per hour. The changeup is next at 25.2 percent and 83.9. The four-seam fastball is third at 21.4 percent and 93.6, the sinker fourth at 19.3 percent and 94.0, and a curveball at 75.5 and a sweeper at 80.2 fill the last 6.4 percent between them.
No pitch in that arsenal is used more than 27.6 percent of the time, and the hardest thing he throws averages 94.0. Pitchers built this way get outs by changing shapes and speeds rather than by beating hitters over the top, and profiles like that tend to produce contact earlier in counts. His strike rate is 63.0 percent and he has allowed a .338 opponent batting average, which is what a lot of early contact looks like once it starts finding grass.
The Case Against, Stated Loudly
Seven starts is a thin file and this page is not going to pretend otherwise. A 71.4 percent hit rate on a seven game sample carries a wide band around it, and the model blends the log down to 58.1 percent for exactly that reason. Anyone treating five of seven as settled evidence is reading a small number as a large one.
The opponent argues the other way too. San Francisco strikes out in 23.5 percent of its plate appearances against left-handed pitching, 317 times in 1347 trips, which is a higher rate than eighteen other clubs post against lefties. That is not a lineup that hands a left-hander cheap outs. Against right-handers the Giants drop to 20.4 percent, fourth lowest in baseball, so the platoon Sandoval draws tonight is genuinely the harder side of their profile.
Then there is the WHIP. Sandoval sits at 1.85 with 47 hits and 16 walks allowed in 34.0 innings. Traffic is the mechanism that pushes a starter toward twenty seven batters faced without pushing him deeper into the game, and that is the one path where this under loses while Sandoval never once looks dominant. His worst start of the season, August 16 in Pittsburgh, was four innings, nine hits, seven earned runs, twenty four hitters faced and six strikeouts. That is the loss condition written in a single line.
Gabriel Hughes At Coors, And The Two Starts That Should Scare You
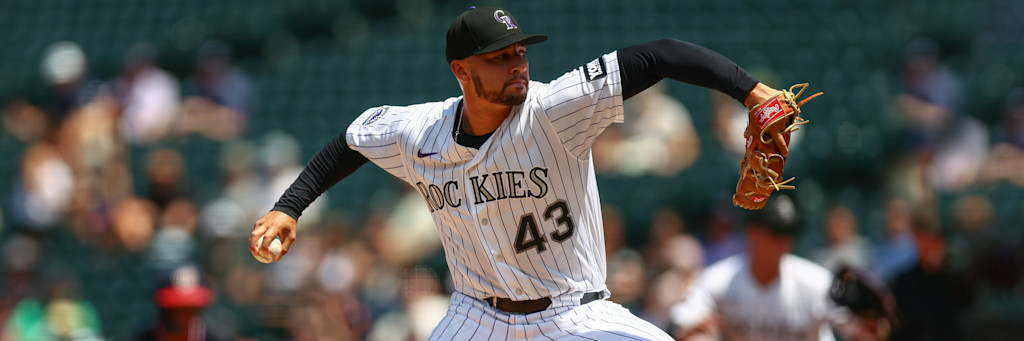
Gabriel Hughes over 3.5 strikeouts at +144 is the second largest edge on the board at plus 7.92 percentage points. A plus 144 price needs only 41.0 percent, the blend puts it at 48.9, and the de-vigged market sits at 38.7. Hughes has 33 strikeouts in 37.2 innings across eight appearances, seven of them starts, behind a 6.69 earned run average and a 1.38 WHIP.
The split that matters is where he pitches. In his three starts at Coors Field he struck out six, five and seven, so the over has landed in 3 of 3 at home. In his four road starts he struck out seven, two, three and two, so the over has landed in 1 of 4. He has also faced at least twenty one hitters in every one of the seven starts, and at his 20.9 percent starter strikeout rate a fourth strikeout arrives near the nineteenth batter. Volume has never been the obstacle for him.
The counterweight is his last two turns, which were ugly in the way that shortens starts. On August 10 in Arizona he gave up seven earned runs in four innings with three strikeouts. On August 16 in San Francisco he gave up seven earned runs in four innings with two strikeouts. Cleveland arrives whiffing in 21.4 percent of its plate appearances against right-handers, eleventh lowest in baseball, which is a middling strikeout offense rather than a friendly one. Hughes throws a four-seam fastball 55.2 percent of the time at 92.3 miles per hour, and a fastball-first profile at Coors Field against a contact club is how two-strikeout nights happen.
Dylan Cease Is The Contract His Own Log Argues With
Dylan Cease under 8.5 strikeouts at -115 graded plus 6.53 percentage points, third largest on the board, and it is the least comfortable of the four strong reads. The price needs 53.5 percent. The blend says 60.0. The raw game log says 47.8, because Cease has finished with eight or fewer strikeouts in 11 of his 23 starts. History does not clear this price, and this page will say so in the same paragraph the model recommends it.
The reasons to be nervous are concrete. Cease has 201 strikeouts in 137.2 innings, a 13.14 per nine rate, and he strikes out 36.3 percent of the hitters he faces. New York whiffs in 24.7 percent of its plate appearances against right-handed pitching, the third highest rate in baseball, which is close to the worst possible opponent for a strikeout under. He has already faced the Yankees twice this season and struck out nine in five innings on May 19 and ten in 6.1 innings on August 16. Both cleared this number. His last five starts read 12, 7, 10, 7 and 10, so the under has landed in two of five.
The reason it grades at all is the market disagreeing with itself. The de-vigged number puts the under at 50.4 percent while the price demands 53.5, and the strikeout engine, which weights recent batters faced and opponent contact rates, comes back far higher than either. That is a model call rather than a history call. Take it with that label attached to it.
The Four Contracts Behind Them
Cody Bradford under 4.5 strikeouts at +112 graded plus 4.15 percentage points. The price needs 47.2 percent and his log says 2 of 3, but three starts is barely a file at all. Bradford has 10 strikeouts in 15.1 innings this season, a 5.87 per nine rate, and on August 11 in Anaheim he threw seven innings on 75 pitches and struck out one. That single start is the whole thesis: he works fast, he lives in the zone at a 69.0 percent strike rate, and he does not chase punchouts. The argument against him is that the Angels strike out in 25.6 percent of their plate appearances against left-handers, the second highest rate in baseball.
David Peterson under 4.5 strikeouts at -130 graded plus 3.60 percentage points and is the most evenly balanced contract on the board. The price needs 56.5 percent and his season log across sixteen starts says 56.3, which is a coin flip to one decimal place. The tilt comes from the trade. With the Mets he struck out 8.34 per nine. Since joining the Cubs he has 32 strikeouts in 44.1 innings, a 6.50 rate, and the under 4.5 has landed in 6 of his 8 Chicago starts. Seattle strikes out in 24.0 percent of its plate appearances against lefties, which is the part of this that does not help.
Jacob Lopez under 4.5 strikeouts at -102 graded plus 3.57 percentage points and it is the contract where the log fights hardest. Lopez has cleared this under in only 7 of 17 starts, 41.2 percent, against a break-even of 50.5, and his last four starts produced eight, nine, five and six strikeouts. Every one of those went over. What the model is buying is the opponent: Houston strikes out in 20.5 percent of its plate appearances against left-handed pitching, the fifth lowest rate in all of baseball, and Lopez has walked 46 hitters in 88.0 innings, which caps how deep he tends to go.
Hunter Brown under 6.5 strikeouts at -148 closes the playable list at plus 3.11 percentage points. The price needs 59.7 percent and his log says 8 of 13, 61.5 percent. Narrow the window to the eleven starts since he returned on June 16 and the under has landed in eight of them, 72.7 percent. Brown has walked 40 hitters in 68.2 innings, a 5.24 per nine rate, and free passes are the thing that ends his outings early. He has thrown more than six innings once all season.
Three Cuts, And The Number That Killed Each
Jared Jones over 4.5 strikeouts at -122 produced the largest edge among the contracts that did not qualify, plus 2.22 percentage points, and it fell to its own log. That price needs 55.0 percent. Jones has struck out five or more hitters in 7 of 14 starts, exactly 50.0 percent, and he draws Tarik Skubal and the Dodgers, a game where a Pittsburgh starter is unlikely to be handed a long leash. His last five starts recorded 5, 5, 4, 3 and 7 strikeouts on 21, 24, 21, 20 and 20 batters faced. Cut.
Shane McClanahan over 4.5 strikeouts at +104 came back at plus 1.94 percentage points and the game log is far more hostile than that edge suggests. The price needs 49.0 percent and McClanahan has cleared 4.5 in only 9 of his 21 starts, 42.9 percent. His last five turns produced 5, 3, 3, 3 and 3 strikeouts, so the over has landed once in five, and the last two of those were a three-inning start and a 3.1-inning start on twelve and fourteen batters faced. A pitcher who has not seen the fifth inning in his last two outings is not a strikeout over. Cut.
Ryan Johnson over 3.5 strikeouts at -156 graded plus 1.45 percentage points against a break-even of 60.9 percent, which is a heavy price for a pitcher whose log says 6 of 12, an even 50.0 percent. Johnson has 47 strikeouts in 60.1 innings with 29 walks and a 6.41 earned run average, and his last five starts covered 3.1, 4.1, 4.2, 4.1 and 5.1 innings. Laying -156 on a starter who has not completed six innings in his last five turns is paying for something the log has never delivered. Cut.
The Pitcher Outs Board Produced Nothing
All twenty seven pitcher outs contracts graded no bet. The closest was Luis Castillo under 17.5 outs at -110 at minus 0.06 percentage points, a rounding error on the wrong side of zero. Behind it came Tanner Bibee under 17.5 outs at minus 0.29, Martin Perez under 14.5 at minus 0.57 and David Peterson under 14.5 at minus 1.25. From there the board fell away quickly and bottomed out at Michael Wacha over 17.5 outs at minus 3.82. When the single best contract in a twenty seven market section still sits below zero, the section is a pass and there is nothing clever to add.
The Transparency Section: No First-Inning Play Today
No YRFI or NRFI market was priced anywhere in today's line pull. The board carried twenty eight strikeout contracts and twenty seven pitcher outs contracts and zero first-inning contracts. With no live price to blend a projection against, there is nothing to grade, and this page will not manufacture a first-inning lean out of park factors and an opening-frame split after the fact. Documented pass, same as the outs board.
The Full Board, Ranked Honestly
| Contract | Price | Break-even | Game log rate | Edge | Verdict |
|---|---|---|---|---|---|
| Patrick Sandoval under 5.5 K | +100 | 50.0% | 5 of 7 starts, 71.4% | +8.12pp | Largest edge |
| Gabriel Hughes over 3.5 K | +144 | 41.0% | 4 of 7 starts, 57.1% | +7.92pp | Strong |
| Dylan Cease under 8.5 K | -115 | 53.5% | 11 of 23 starts, 47.8% | +6.53pp | Strong, model call |
| Cody Bradford under 4.5 K | +112 | 47.2% | 2 of 3 starts, 66.7% | +4.15pp | Strong, thin sample |
| David Peterson under 4.5 K | -130 | 56.5% | 9 of 16 starts, 56.3% | +3.60pp | Lean, model call |
| Jacob Lopez under 4.5 K | -102 | 50.5% | 7 of 17 starts, 41.2% | +3.57pp | Lean, model call |
| Hunter Brown under 6.5 K | -148 | 59.7% | 8 of 13 starts, 61.5% | +3.11pp | Lean |
| Jared Jones over 4.5 K | -122 | 55.0% | 7 of 14 starts, 50.0% | +2.22pp | Cut |
| Shane McClanahan over 4.5 K | +104 | 49.0% | 9 of 21 starts, 42.9% | +1.94pp | Cut |
| Ryan Johnson over 3.5 K | -156 | 60.9% | 6 of 12 starts, 50.0% | +1.45pp | Cut |
| Luis Castillo over 4.5 K | -138 | 58.0% | Not evaluated further | +1.04pp | No bet |
| Christian Scott over 6.5 K | +132 | 43.1% | Not evaluated further | +0.59pp | No bet |
| Logan Henderson under 6.5 K | -113 | 53.1% | Not evaluated further | +0.53pp | No bet |
| Michael Wacha over 4.5 K | +122 | 45.0% | Not evaluated further | +0.29pp | No bet |
| Tanner Bibee under 4.5 K | -113 | 53.1% | Not evaluated further | +0.17pp | No bet |
| Luis Castillo under 17.5 outs | -110 | 52.4% | Best outs contract on the board | -0.06pp | No bet |
| Tanner Bibee under 17.5 outs | +132 | 43.1% | Second best outs contract | -0.29pp | No bet |
| Michael Wacha over 17.5 outs | -160 | 61.5% | Worst contract on the board | -3.82pp | No bet |
Edge is the blended probability of the listed side minus the break-even the posted price demands, in percentage points. The de-vigged market numbers the engine was measured against were 47.1 percent on the Sandoval under, 38.7 on the Hughes over, 50.4 on the Cease under, 44.6 on the Bradford under, 53.3 on the Peterson under, 47.6 on the Lopez under and 56.3 on the Brown under. Fifty five contracts were priced across all fifteen games. Nothing on this page carries a tracked unit and no pick here is posted to any record.
The Last Board, For The Record
August 20 led with Jacob deGrom over 5.5 strikeouts at -125 as the only playable contract out of twelve, on a page that refused to invent a second read. That board also documented two cuts, Grayson Rodriguez under 4.5 at plus 1.77 percentage points and Peter Lambert over 5.5 at minus 0.94, and published its outs section and its first-inning section as passes. Today is the opposite problem. Fifty five contracts produced seven qualifiers instead of one, and the discipline shifts from refusing to add a play to refusing to pretend all seven carry the same weight. Four of them clear their price on raw history. Three of them do not.
Final Verdict
Patrick Sandoval under 5.5 strikeouts at +100 is the largest edge on the August 22 board, and the reasons are specific: 71.4 percent on a seven start log against a 50.0 percent price, 5.0 strikeouts per start, a season high of seven, a 21.9 percent strikeout rate that puts a sixth punchout near the twenty seventh hitter, and an average of 22.9 batters faced per outing that has crossed twenty seven exactly once. Six pitches with nothing above 27.6 percent usage and a hardest offering at 94.0 is a contact-tolerant profile rather than a bat-missing one. The reasons to be nervous are equally specific and this page is not hiding them: seven starts is a thin file, San Francisco whiffs in 23.5 percent of its plate appearances against left-handers, and a 1.85 WHIP is exactly the mechanism that stretches a start to twenty seven hitters. Gabriel Hughes over 3.5 at +144 and Dylan Cease under 8.5 at -115 are the other two strong reads worth writing up, and the Cease under is a model call that its own game log argues with at 11 of 23. Jared Jones over 4.5, Shane McClanahan over 4.5 and Ryan Johnson over 3.5 were cut on their own logs. All twenty seven pitcher outs contracts graded no bet and no first-inning market was priced, so both sections publish as documented passes. Analysis only, no tracked units, no grades against the season record. Nima selects his own player props.
Frequently Asked Questions
What is the MLBProps.com headline read for August 22, 2026?
Patrick Sandoval under 5.5 strikeouts at +100, with the over at -128, for the San Francisco Giants at the Boston Red Sox, first pitch 7:15 PM ET at Fenway Park opposite Blade Tidwell. Even money needs 50.0 percent. Sandoval has finished with five or fewer strikeouts in 5 of his 7 starts this season, 71.4 percent, and his season high is seven.
How many contracts were on the board and how many are playable?
Fifty five contracts were priced and evaluated across all fifteen games, twenty eight strikeout markets and twenty seven pitcher outs markets. Seven graded playable and every one of them is a strikeout contract. All twenty seven pitcher outs contracts graded no bet, the best of them Luis Castillo under 17.5 outs at minus 0.06 percentage points.
What is the strongest argument against the Sandoval under?
Seven starts is a thin file, and San Francisco strikes out in 23.5 percent of its plate appearances against left-handed pitching, which is more often than eighteen other clubs. Sandoval also carries a 1.85 WHIP and a .338 opponent batting average, and traffic on the bases is what pushes a pitcher toward the twenty seven hitters this number needs.
Which contracts were cut and what killed each one?
Jared Jones over 4.5 strikeouts at -122 graded plus 2.22 percentage points and was cut because the price needs 55.0 percent while he has cleared 4.5 in 7 of 14 starts, exactly 50.0 percent. Shane McClanahan over 4.5 at +104 graded plus 1.94 and his log is worse, 9 of 21 starts at 42.9 percent against a break-even of 49.0, with the over landing in one of his last five. Ryan Johnson over 3.5 at -156 graded plus 1.45 against a break-even of 60.9 percent and a log of 6 of 12, 50.0 percent.
Was there a pitcher outs play or a first-inning play today?
No to both. All twenty seven pitcher outs contracts graded no bet and the entire outs board ran from minus 0.06 percentage points on Luis Castillo under 17.5 down to minus 3.82 on Michael Wacha over 17.5. No YRFI or NRFI market was priced in the line pull, so there is no price to grade a projection against. Both sections publish as documented passes.
Are these tracked picks?
No. Everything on this page is analysis only with no tracked units and no effect on the season record. Nima selects his own player props and the BetLegend card is a separate document.