Thirty-Four First-Inning Strikeouts, Five First-Inning Home Runs. The Card Still Says No Runs.
Kyle Harrison has faced 67 hitters in the first inning this season and walked three of them. Paul Skenes has faced 96 in the same frame and struck out 34, which is the best rate of any inning he throws, and he has also given up five home runs in it. Those two lines are the whole opening frame in Milwaukee tonight. The tracked card takes no runs in the first at -150 for 2 units, and it is one of three picks inside this single game. Everything after the card on this page is model research with no stake attached.
Graded, August 5 final: The tracked BetLegend card went 9-0 for +11.32 units, a clean sweep of every play on it. The headline NRFI at -150 (2u) landed on a scoreless opening frame at American Family Field for +1.33u. Pirates at Brewers under 7 at -105 (1.5u) won at six total runs in Milwaukee's 4-2 win for +1.43u, and Pittsburgh team total under 3.5 at -130 (1u) won at two runs for +0.77u. The six moneylines and totals outside that game all held: Red Sox at -131 (2u) beat the White Sox 4-0 at Fenway for +1.53u, Mariners at -146 (1u) beat Detroit 4-2 for +0.68u, Rangers at -156 (3u) shut out San Francisco 6-0 at Globe Life Field for +1.92u, Rays at -158 (1u) won 4-0 at Coors Field for +0.63u, Athletics team total under 4.5 at -120 (2u) landed at two runs for +1.67u, and Reds at -148 (2u) won 3-2 at Great American Ball Park for +1.35u. On the research side, which carries no stake and no grade, Paul Skenes struck out 6 over 5.0 innings, so the model's under 6.5 side landed, while Kyle Harrison struck out 10 over 5.0 innings opposite him. Every result confirmed against the official box scores.
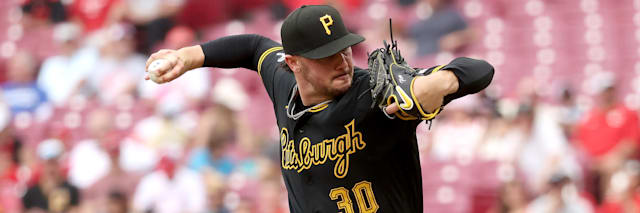
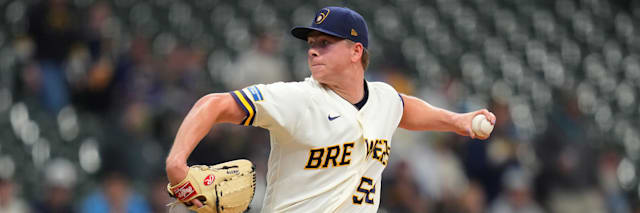
The First Inning In Milwaukee
Harrison is the reason this frame is quiet. He has thrown 17.0 first innings across 17 starts with a 2.65 earned run average, 19 strikeouts, 3 walks and a .190 average against. Three walks in 67 opening-frame plate appearances is the number that carries the ticket, because a first inning run almost always begins with a free baserunner and Harrison hands them out at a rate almost nobody matches. His full season line supports it too: 101 strikeouts in 83.2 innings, a 3.01 earned run average and a 1.08 WHIP.
Skenes is the harder half to defend, and the way he is hard is specific. His opening frame is his best strikeout inning by a distance, 34 punchouts in 96 batters faced, which is 35.4 percent against a season rate of 30.5 percent. He has also allowed 5 home runs and a 5.16 earned run average in that same inning. One swing ends this, and it has ended it five times already.
Then the base rates, stated plainly because they do not flatter the price. Pirates games have opened with a scoreless first inning 61 times in 115 tries, 53.0 percent. Brewers games have done it 60 times in 113, 53.1 percent. A -150 ticket needs 60.0 percent. Neither club's season shape reaches that on its own, which means every bit of the cushion has to come from these two starters being better than the average opening-frame arm. Harrison clearly is. Skenes is, in strikeouts, while also being the likeliest man on the field to give up a solo shot in the first. That is the honest shape of the wager, and 2 units rather than a bigger number is the size that reflects it.
The offensive halves are close to neutral. Pittsburgh has scored 63 first-inning runs with a .251 average and a .764 on-base plus slugging in the frame, and 21 first-inning home runs. Milwaukee has scored 64 with a .247 average, a .736 mark and 13 first-inning homers. Neither is a soft touch and neither is a wrecking ball.
The Full Card, At Its Exact Numbers
Tracked picks, at the card's exact numbers
Pirates vs Brewers NRFI, first inning under 0.5 runs (-150), 2 units; Pirates at Brewers UNDER 7 (-105), 1.5 units; Pittsburgh Pirates team total UNDER 3.5 (-130), 1 unit, all at American Family Field; Boston Red Sox moneyline (-131), 2 units, White Sox at Red Sox at Fenway Park; Seattle Mariners moneyline (-146), 1 unit, Tigers at Mariners at T-Mobile Park; Texas Rangers moneyline (-156), 3 units, Giants at Rangers at Globe Life Field; Tampa Bay Rays moneyline (-158), 1 unit, Rays at Rockies at Coors Field; Athletics team total UNDER 4.5 (-120), 2 units, and Cincinnati Reds moneyline (-148), 2 units, Athletics at Reds at Great American Ball Park.
Those are the BetLegend picks at the lines and odds the card was placed at, and boards elsewhere will vary. The heaviest number is Texas at 3 units, a 56-58 club laying -156 at home behind Cody Bradford against a San Francisco team sitting at 48-66. Three of the nine sit inside the Pirates and Brewers game, which is unusual concentration and worth naming: the first inning no run, the under 7 and the Pittsburgh team total under 3.5 all lean the same direction, so they win together and they lose together. The honest counterpoint on that cluster is Milwaukee itself, a lineup hitting .254 and scoring 4.97 runs a game with the best record in baseball at 70-43, at home. On the Cincinnati side the card is buying a 54-58 team at -148 against a 45-68 Athletics club while also taking the Athletics under 4.5 runs, which is the same read expressed twice.
The Model's Widest Disagreement Is With Paul Skenes
On July 25 at PNC Park, Skenes struck out eleven Chicago Cubs. He needed 105 pitches to do it and he was gone after 5.1 innings, having faced 25 hitters. That single line score contains the entire argument the model is making. The stuff is the best in the sport. The workload is ordinary.
Skenes has struck out 156 hitters in 124.2 innings across 23 starts, an 11.26 per nine rate and a 30.5 percent share of every batter he has faced. He also averages 6.78 strikeouts per start, which is under 7, and the reason is arithmetic: 512 batters faced divided by 23 starts is 22.26 hitters a night.
Look at the tail and it sharpens. He has faced 26 or more hitters in exactly two starts all season, eight innings at Arizona on May 6 and eight innings against Colorado on May 12. Two out of twenty-three. He has crossed 100 pitches nine times. His last five outings have run 6.0, 5.1, 7.0, 5.1 and 4.0 innings, and the two shortest of those still cost him 105 and 100 pitches. Pittsburgh is not protecting an injury. He is expensive per out, and expensive per out means a seventh strikeout has to arrive inside about 22 hitters or it does not arrive.
The Road Version Of Paul Skenes
At PNC Park, Skenes has thrown 73.1 innings over 13 starts with 99 strikeouts in 295 batters faced, a 33.6 percent rate, a 12.15 per nine mark, a 3.44 earned run average and a 1.01 WHIP. Away from it, across 10 starts and 51.1 innings, he has 57 strikeouts in 217 batters faced. That is 26.3 percent, 9.99 per nine, a 4.56 earned run average and a 1.27 WHIP.
Seven points of strikeout rate is an enormous home and road gap for any pitcher, and it comes with a shorter start attached: 21.7 hitters faced per road outing against 22.7 at home. Tonight is a road start.
Milwaukee Does Not Strike Out, And Milwaukee Is 70-43
The second half of the model's read is the lineup. Milwaukee has struck out 924 times in 4,382 plate appearances, 21.09 percent, which ranks 24th among the 30 clubs and sits a full point below the 22.12 percent league mark. Against right-handed pitching specifically, in 3,148 trips, the Brewers whiff 21.16 percent of the time. At home they sit at 21.39 percent. They hit .254 with a .735 on-base plus slugging, score 4.97 runs a game, and their 70-43 record is the best in baseball.
Contact lineups extend innings. Extended innings raise pitch counts. Raised pitch counts end starts. Take his road rate of 26.3 percent, scale it by the Milwaukee mark against the league mark, and you get roughly 25.1 percent. Multiply that by 21.7 hitters and the arithmetic lands on 5.4 strikeouts. Do the same with his full season rate and 22.26 hitters and you get 6.5. The model's number sits below the posted 6.5 on both versions of that calculation, and the market is implying about 57.5 percent for the over. That is the disagreement, stated as a disagreement.
What Argues The Other Way, And It Argues Loudly
Skenes has finished above 6.5 strikeouts in 15 of his 23 starts. That is 65.2 percent. Eight of his last ten went over. The 11 strikeouts against the Cubs on July 25 came in 5.1 innings, which is the exact refutation of the volume argument, and the 7 he took from Cincinnati on July 31 came in 4.0 innings.
He has also already faced this lineup twice. On April 24 in Milwaukee he threw seven innings, faced 22 hitters and struck out 7. On July 12 in Pittsburgh he went 5.1, faced 20 and struck out 7 again. Fourteen strikeouts in 42 batters faced against these Brewers is a 33.3 percent rate, higher than his season mark, not lower.
Narrow it to road starts, where the rate case actually lives, and he has finished under the number in 4 of 10. This is a live disagreement between a rate model and a season log, the log is currently winning, and that is precisely why it appears here as research rather than as a stake. A model conclusion this contrarian earns publication and scrutiny. It has not earned anybody's money.
The Other Ten Disagreements
Tomoyuki Sugano at 2.5, Rays at Rockies, Coors Field, 3:10 PM ET. A 36 year old contact pitcher with a 5.08 strikeouts per nine rate is lined at three. Sugano averages 3.05 strikeouts across 19 starts while facing 22.58 hitters a night, he has finished above 2.5 in 12 of those 19, and he has thrown at least five innings in 17 of them. Pointing the other way: Tampa Bay owns the lowest strikeout rate in baseball at 19.13 percent, 19.48 percent against right-handers, and Sugano has landed on exactly 2 in three of his last six.
Jake Irvin at 3.5, Nationals at Phillies, Citizens Bank Park, 6:40 PM ET. Twelve starts, 59 strikeouts in 56.2 innings, a 9.37 per nine rate, and 10 of the 12 finished above 3.5. Philadelphia strikes out in 23.45 percent of its plate appearances, seventh most in baseball, and 23.32 percent against right-handers. Pointing the other way is his calendar: Irvin made his 11th start on May 23 and his 12th on July 30, and that return produced 1 strikeout across 5.0 innings on 61 pitches. One data point after a two month gap is not a trend, and it is also the only recent evidence anyone has.
Reid Detmers at 6.5, Angels at Orioles, Camden Yards, 6:35 PM ET. The other big under in the model's output, on a cleaner log than the Skenes one. Detmers has finished below 6.5 in 12 of 22 starts, averaging 6.59 strikeouts across 5.7 innings a start. Pointing the other way: Baltimore strikes out in 25.58 percent of its plate appearances against left-handed pitching, the profile Detmers presents, and he struck out 9 Houston hitters on July 28.
Sean Burke at 5.5, White Sox at Red Sox, Fenway Park, 7:10 PM ET. A form disagreement. Burke has 140 strikeouts in 124.1 innings with a 3.04 earned run average, and his last five starts read 11, 9, 5, 10 and 10 while facing 22.94 hitters a start at a 10.13 per nine rate. Pointing the other way is the full season: he has finished above 5.5 in only 10 of his 18 starts, and Boston whiffs at just 21.86 percent overall and 21.16 percent at home.
Andre Pallante at 4.5, Cardinals at Yankees, Yankee Stadium, 7:05 PM ET. The most contrarian item after the headline one, and the log hates it. Pallante carries a 6.52 per nine rate and averages 4.10 strikeouts, finishing above 4.5 in 8 of 21 starts. The model's case is entirely the opponent: New York strikes out in 24.35 percent of its plate appearances, third most in baseball, 24.17 percent against right-handers, and Pallante faces 23.62 hitters a start, the most of anyone in this section.
Bryce Elder at 4.5, Marlins at Braves, Truist Park, 7:15 PM ET. Elder averages 4.81 strikeouts across 21 starts at a 7.60 per nine rate, and 11 of them finished below 4.5. Miami whiffs at 21.61 percent overall and 20.98 percent against right-handers. Pointing the other way is his ceiling: 8 strikeouts against Baltimore on July 25 says the top of his range clears this number without much trouble.
Jacob Lopez at 5.5, Athletics at Reds, Great American Ball Park, 6:40 PM ET. The strongest raw log in the section. Lopez has finished below 5.5 in 11 of his 14 starts, averaging 3.79 strikeouts across 20.43 hitters faced with a 5.79 earned run average and a 1.67 WHIP keeping his outings short. Pointing the other way is severe: Cincinnati strikes out in 25.17 percent of its trips, second most in baseball, 26.25 percent at home, and Lopez struck out 8 Boston hitters on July 29, his season high.
Eric Lauer at 3.5, Dodgers at Cubs, Wrigley Field, 2:20 PM ET. One of three narrow disagreements, meaning the model and the market are close to agreeing. A 5.73 per nine rate and 3.29 strikeouts a start against a number of 3.5 leaves almost no room, and only 6 of 14 starts have finished above it while Chicago whiffs at just 20.69 percent inside Wrigley Field. What keeps it on the list is length: at least 5.1 innings in six straight and 21.57 hitters faced a start.
Christian Scott at 5.5, Mets at Guardians, Progressive Field, 6:40 PM ET. The best rate among the narrow items by a distance. Scott has 85 strikeouts in 69.1 innings, an 11.03 per nine mark with a 2.99 earned run average, and 9 of 15 starts finished above 5.5. The limit is that he faces 19.67 hitters a start, the fewest of any pitcher here, because his outings keep ending around the fifth. Cleveland whiffs at 22.14 percent, a mild tailwind rather than a wall.
Eury Perez at 5.5, Marlins at Braves, Truist Park, 7:15 PM ET. The same game as the Elder item, on the other mound. Perez has finished above 5.5 in 13 of 19 starts, with 112 strikeouts in 104.2 innings and a 3.44 earned run average. Pointing the other way is Atlanta, which whiffs at 21.20 percent overall and 21.30 percent against right-handers, and Perez himself, who struck out 2 across 7.0 innings against San Diego on July 25 without ever being in trouble.
| Contract | Number | Posted price | Implied / break-even | Season log | Status |
|---|---|---|---|---|---|
| Pirates vs Brewers, first inning | No runs | -150 | 60.0% | Scoreless first in 53.0% of Pirates games, 53.1% of Brewers games | CARD PICK |
| Pirates at Brewers, game total | Under 7 | -105 | 51.2% | Milwaukee scores 4.97 runs a game, Pittsburgh 5.08 | CARD PICK |
| Pittsburgh Pirates, team total | Under 3.5 | -130 | 56.5% | Pirates strike out 26.16% of the time on the road | CARD PICK |
| Paul Skenes K, Pirates at Brewers | 6.5 | -156 / +122 | market 57.5% over | 8 of 23 starts under, 26.3% strikeout rate on the road | RESEARCH: MODEL UNDER |
| Tomoyuki Sugano K, Rays at Rockies | 2.5 | -115 / -111 | market 50.4% over | 12 of 19 starts over, 22.6 batters faced per start | RESEARCH: MODEL OVER |
| Jake Irvin K, Nationals at Phillies | 3.5 | -125 / -102 | market 52.4% over | 10 of 12 starts over, 9.37 strikeouts per nine | RESEARCH: MODEL OVER |
| Reid Detmers K, Angels at Orioles | 6.5 | -154 / +120 | market 57.2% over | 12 of 22 starts under, 5.7 innings per start | RESEARCH: MODEL UNDER |
| Sean Burke K, White Sox at Red Sox | 5.5 | -142 / +112 | market 55.4% over | 10 of 18 starts over, 10.13 strikeouts per nine | RESEARCH: MODEL OVER |
| Andre Pallante K, Cardinals at Yankees | 4.5 | +108 / -138 | market 45.3% over | 8 of 21 starts over, 23.6 batters faced per start | RESEARCH: MODEL OVER |
| Bryce Elder K, Marlins at Braves | 4.5 | -138 / +108 | market 54.7% over | 11 of 21 starts under, 7.60 strikeouts per nine | RESEARCH: MODEL UNDER |
| Jacob Lopez K, Athletics at Reds | 5.5 | +108 / -138 | market 45.7% over | 11 of 14 starts under, 3.79 strikeouts per start | RESEARCH: MODEL UNDER |
| Eric Lauer K, Dodgers at Cubs | 3.5 | -104 / -120 | market 51.5% over | 6 of 14 starts over, 5.73 strikeouts per nine | RESEARCH: NARROW |
| Christian Scott K, Mets at Guardians | 5.5 | +128 / -164 | market 43.4% over | 9 of 15 starts over, 19.7 batters faced per start | RESEARCH: NARROW |
| Eury Perez K, Marlins at Braves | 5.5 | +108 / -138 | market 45.7% over | 13 of 19 starts over, 9.63 strikeouts per nine | RESEARCH: NARROW |
Where The Model Sits Furthest From The Market
How to read this page. The tracked pick is Pirates vs Brewers no runs in the first inning at -150 for 2 units, alongside eight more BetLegend card picks at their exact numbers. Skenes, Sugano, Irvin, Detmers, Burke, Pallante, Elder, Lopez, Lauer, Scott and Perez appear here as model research only. Their numbers are verified against the live 2026 league record and their prices were read off the FanDuel and DraftKings boards this morning, and none of them is a pick, a play or a suggestion to bet. As with every board since July 8, the analyzer output publishes as analysis with no tracked units.
What Tonight Actually Tests
The card is on the opening frame in Milwaukee. It needs Harrison to keep doing what he has done for 67 first-inning hitters, and it needs Skenes to get through one inning without the one swing that has beaten him five times. The base rates do not cover the price on their own, the arms have to, and 2 units is the size that reflects that.
The research is a separate thing entirely. A strikeout model that priced 54 contracts came back saying its widest disagreement with the market is a fade of Paul Skenes, and it got there through workload rather than stuff: 22.26 hitters a start, 26.3 percent on the road, and a Milwaukee lineup that puts the ball in play well enough to be 70-43. The evidence against that conclusion is a 65.2 percent over rate across 23 starts and two 7 strikeout nights against these same Brewers. Publishing both halves of that, with no stake on either, is the point of the section.
Back tomorrow with a fresh slate.
Frequently Asked Questions
Pirates vs Brewers no runs in the first inning at -150 for 2 units, American Family Field, 7:40 PM ET. Two more card picks sit in the same game, the under 7 at -105 for 1.5 units and the Pittsburgh team total under 3.5 at -130 for 1 unit, and six more are listed in the card block above. Those nine are the only wagers here.
Kyle Harrison has thrown 17.0 first innings with a 2.65 earned run average, 19 strikeouts, 3 walks and a .190 average against, and three walks in 67 opening-frame hitters is what strangles early rallies. Paul Skenes has struck out 34 of 96 first-inning batters faced, 35.4 percent, his best inning by rate. The counterpoint is that Skenes has allowed 5 first-inning home runs with a 5.16 earned run average in the frame, and that Pirates games open scoreless 53.0 percent of the time against a price needing 60.0 percent.
No. Nothing in the strikeout section is a pick, a play or a recommendation, and no units are attached to any of it. The analyzer priced 54 contracts and its widest gap with the market landed on Skenes at 6.5, where the market implies roughly 57.5 percent for the over. That gets published as research because a model arguing against the best strikeout arm in the sport deserves scrutiny, not because anybody should back it.
Workload rather than stuff. He has struck out 156 of 512 hitters faced, 30.5 percent, while averaging 22.26 batters per start and reaching 26 batters faced exactly twice in 23 tries. On the road the rate falls to 26.3 percent, 57 strikeouts in 217 batters faced. Milwaukee whiffs 21.16 percent of the time against right-handers, under the 22.12 percent league mark. The evidence against is heavy: 15 of 23 starts finished above the number, eight of the last ten, and 7 strikeouts in each of his two starts against these Brewers.
Jacob Lopez, Sean Burke and Eric Lauer. Lopez has 14 starts inside 17 appearances at 3.79 strikeouts and 20.43 batters faced per start, Burke has 18 inside 22, and Lauer has 14 inside 17 with a 5.73 strikeouts per nine rate. Nothing here projects more than 7.5 innings or more than 9 strikeouts for any pitcher on the page, including Skenes, whose projection tops out near six.