What The Number Is Asking
The line on Cole tonight is 15.5 outs. Put simply: does he get the first out of the sixth inning? Record the 16th out and the over cashes. Walk off after five clean innings and it doesn’t.
The over is posted at -145 and the under at +105. Strip the vig from both sides and the market has the over at roughly 54.8 percent. His own season says 80.00.
That’s a big disagreement for a pitcher this well known. Usually the book is pricing in something the game log can’t show. Tonight the obvious candidate is sitting right at the bottom of the table: the last start.
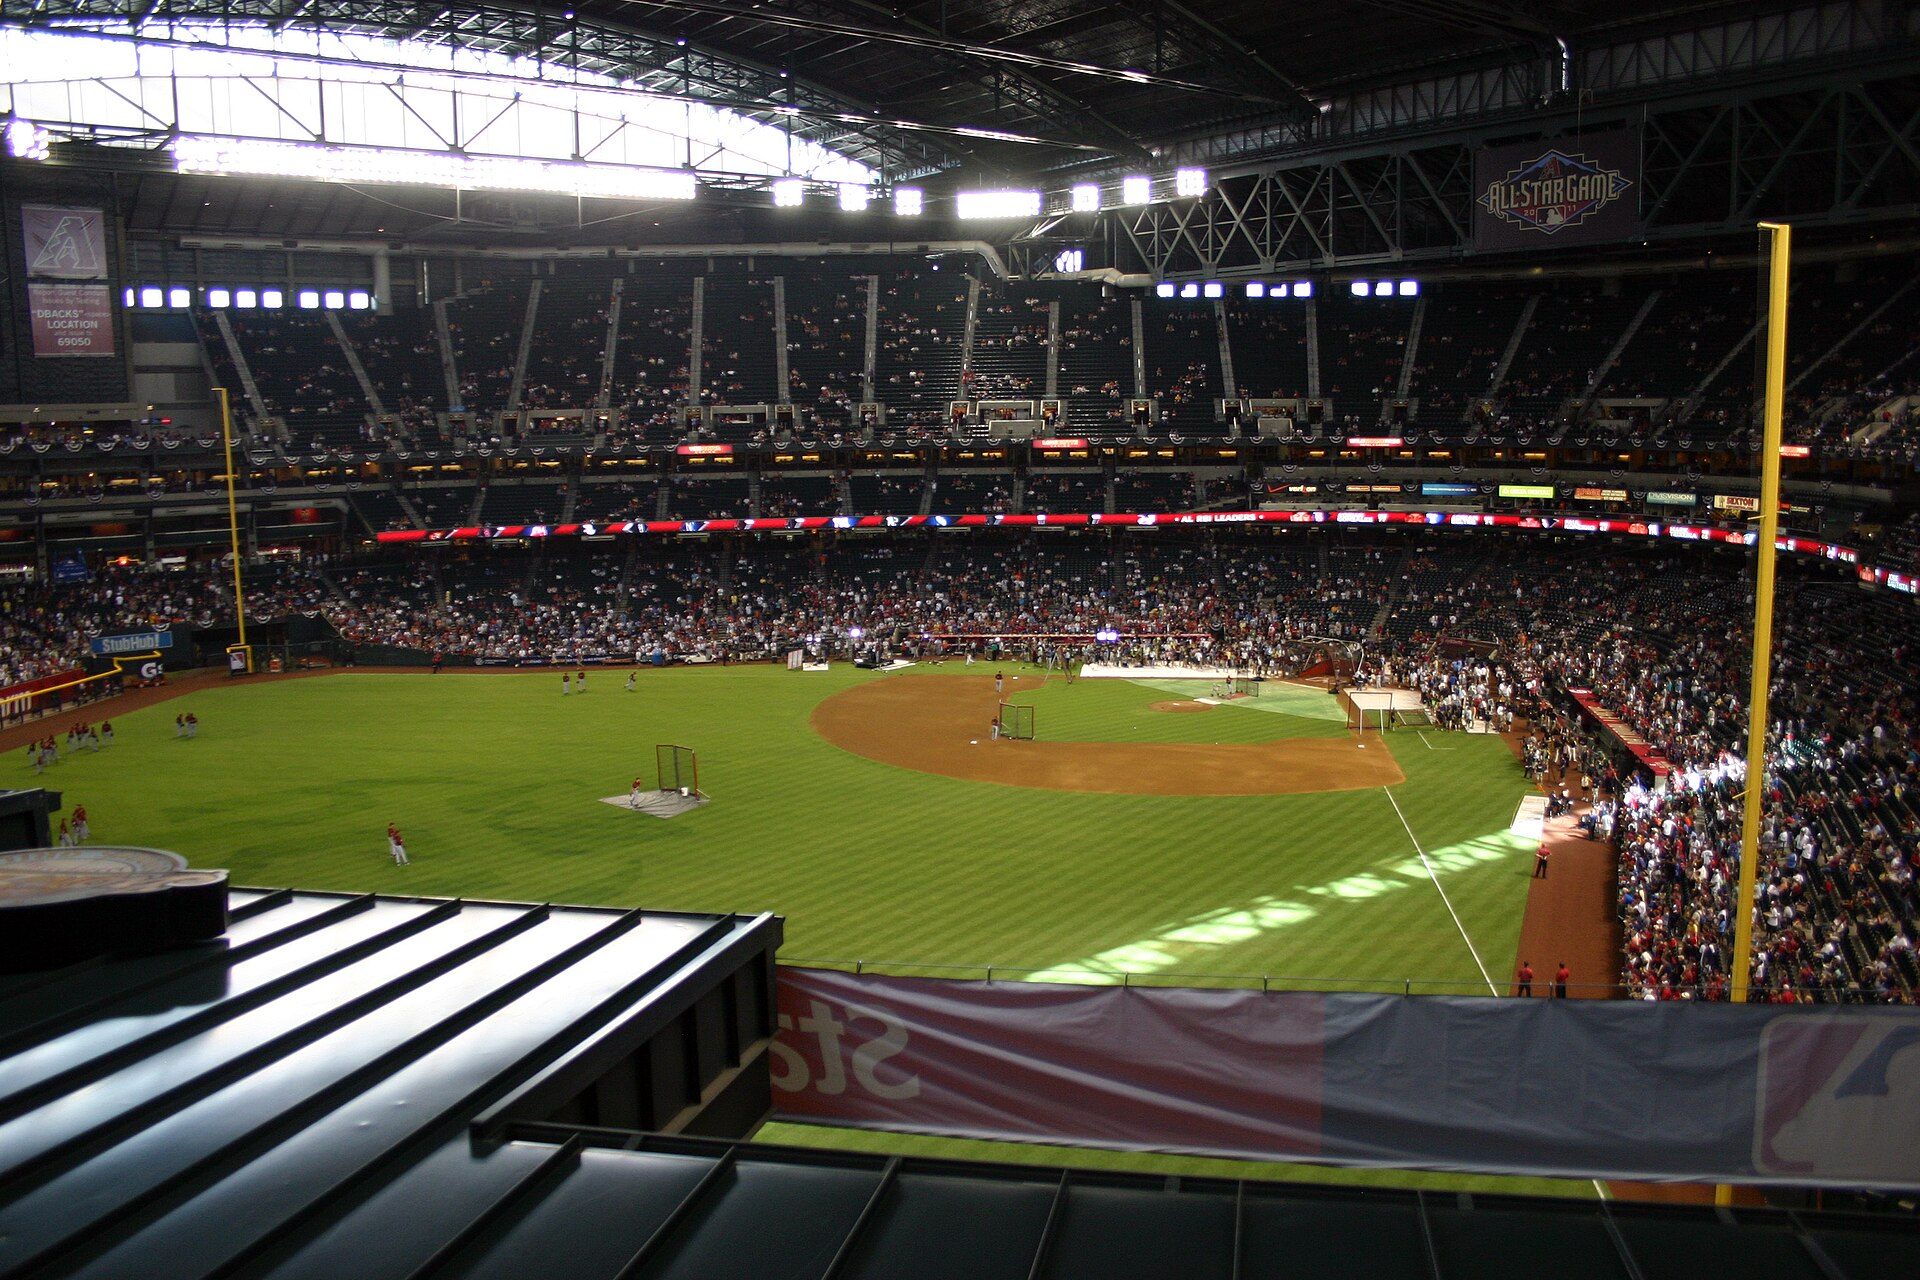
First pitch is 6:40 Pacific at Chase Field in Phoenix. The New York Yankees come in at 88 and 64, holding the top American League wild card spot and 7 and 3 over their last 10. The Arizona Diamondbacks are 80 and 73, four games out of the last National League wild card spot, with a 43 and 35 record at home. Cole’s opponent on the mound is Eduardo Rodriguez, 15 and 6 with a 2.62 ERA over 178.1 innings.
Every 2026 Start
| Date | Opponent | IP | Pitches | Outs | Result vs 15.5 |
|---|---|---|---|---|---|
| 05/22 | Tampa Bay Rays | 6.0 | 72 | 18 | OVER |
| 05/27 | Kansas City Royals | 6.2 | 79 | 20 | OVER |
| 06/03 | Cleveland Guardians | 5.1 | 83 | 16 | OVER |
| 06/09 | Cleveland Guardians | 4.0 | 83 | 12 | under |
| 06/16 | Chicago White Sox | 6.0 | 90 | 18 | OVER |
| 06/22 | Detroit Tigers | 4.1 | 89 | 13 | under |
| 06/27 | Boston Red Sox | 5.1 | 89 | 16 | OVER |
| 07/03 | Minnesota Twins | 5.0 | 88 | 15 | under |
| 07/08 | Tampa Bay Rays | 6.1 | 97 | 19 | OVER |
| 07/17 | Los Angeles Dodgers | 6.0 | 103 | 18 | OVER |
| 07/22 | Pittsburgh Pirates | 7.0 | 93 | 21 | OVER |
| 07/28 | Chicago White Sox | 6.0 | 99 | 18 | OVER |
| 08/02 | Chicago Cubs | 5.2 | 99 | 17 | OVER |
| 08/08 | Atlanta Braves | 7.0 | 82 | 21 | OVER |
| 08/14 | Toronto Blue Jays | 6.0 | 87 | 18 | OVER |
| 08/20 | Baltimore Orioles | 6.0 | 93 | 18 | OVER |
| 08/27 | Houston Astros | 6.0 | 79 | 18 | OVER |
| 09/01 | Los Angeles Angels | 5.1 | 90 | 16 | OVER |
| 09/06 | San Diego Padres | 7.0 | 84 | 21 | OVER |
| 09/12 | New York Mets | 4.1 | 77 | 13 | under |
Sixteen greens, four reds. His first start of the season came on May 22, so this is a 20 start sample rather than 30, but it’s a consistent one. He’s averaging 17.30 outs a start, nearly two clear of the line, on 87.8 pitches. The full season line: 20 starts, 115.1 innings, a 3.67 ERA and a 1.13 WHIP, with 117 strikeouts and just 22 walks.
The Shape Of It
The tallest bar is 18. Seven of his 20 starts ended at exactly six innings, which is the Yankees’ default with him, and it clears this number by two outs. That cushion is the difference between this page and yesterday’s, where the pitcher kept landing right on the line.
It isn’t all cushion, though. Three starts stopped at exactly 16 outs, one out to spare. And the four misses weren’t near misses: 12, 13, 13 and 15.
The Start Everyone Remembers
Last Saturday against the Mets at Yankee Stadium, Cole lasted 4.1 innings: nine hits, five earned runs and three home runs on 77 pitches in a 12 to 2 loss. It’s the only miss in his last 10, and it’s the freshest thing in the book’s memory.
Before that, nine of 10 cleared 15.5 going back to July 22, including a seven inning, 21 out start against San Diego on September 6 on just 84 pitches.
The home run is the thread running through his season. He’s allowed 20 in 115.1 innings, 1.56 per nine, and when the ball starts leaving the yard, the Yankees don’t wait around.
Pitch Count Isn’t The Problem
Cole needs about 5.08 pitches for every out, so 16 outs costs him roughly 81 pitches. His season high is 103, and he’s averaged 87.8. In other words, the leash covers this number with room left over.
That’s why the misses look the way they do. Every one of the four came at 89 pitches or fewer. He doesn’t run out of pitches before he runs out of innings. When he falls short, it’s because he got hit.
The Arizona Lineup Is The Argument Against
This isn’t a lineup that gives outs away. Arizona strikes out in 19.47 percent of its plate appearances, the third lowest rate in baseball. It also sees 3.94 pitches per plate appearance, 7th most, against a league average of 3.89.
That combination, lots of contact and long at bats, is exactly what drives a pitch count up. The Diamondbacks carry a .742 OPS at home, against .713 overall, and a .689 OPS against right handed pitching.
The park itself is no villain. Games at Chase Field are averaging 8.76 total runs in 2026, across 76 games, a touch under the 8.99 everywhere else.
Why This Row And Not The Others
Bovada had props posted on all 15 games when this board was read: 102 posted sides, 82 of them measured on 21 pitchers with at least eight 2026 starts. 34 of the 82 beat their own price. The median gap is -3.49 points, which is what a normal board looks like: most rows lose to the price.
Two rows read bigger than this one, and both are traps. Chase Burns, over 3.5 strikeouts at -150, shows +29.29, and Kyle Leahy, over 8.5 outs at -220, shows +27.68. But Burns threw 44 and 56 pitches in his last two starts, and Leahy has thrown 51, 55 and 38 in his last three. Those lines are low because the workloads are short, and a full season hit rate can’t see that.
Cole’s own strikeout over, 4.5 at -135, reads as +17.55, 15 of 20. It’s the harder ask against a lineup that rarely strikes out.
Across the field, Eduardo Rodriguez over 17.5 outs at -105 reads as +12.11, 19 of 30. Both starters clear their own outs lines more often than the prices suggest, which says something about how the book sees this game.
What Would Make This Wrong
The last start. Three home runs in 4.1 innings could be noise, or it could be a 36 year old arm in mid September. A game log can’t tell the difference yet.
The lineup. Arizona makes contact and works counts. If the balls in play find holes, the sixth never comes.
The price. A book hanging -145 on a pitcher who has cleared this in 9 of 10 is saying it trusts his recent start more than his season. It sees bullpen plans a game log never will.
What cuts the other way. A two out cushion on his most common outcome, a pitch count that has never been the reason he fell short, and a team with a wild card spot to protect that has every reason to lean on him.
Bottom line for the desk: the full season says Gerrit Cole records 16 outs 80.00 percent of the time against a 59.18 percent break even, and 9 of his last 10 starts agree. Against that sits the worst start of his season six days ago and a Diamondbacks lineup that makes pitchers work for every out. The season and the last start are pulling in opposite directions tonight, which is exactly why this page carries no play.