Saturday gives us a fat slate and a board that actually rewards homework. The model spat out six pitcher props it likes and zero first-inning numbers worth touching, and that split tells you everything about how this site approaches a day. We do not force action. When the prices on the strikeout and outs ladders leave room and the first-inning markets do not, we lean into the first group and walk away from the second without flinching. The total exposure on the card is nine units across six legs, weighted toward the spots with the cleanest separation between projection and line.
Before any of these went on the card, every season line was checked against public stat pages, every probable was confirmed on the June 6 grid, and every opposing lineup's strikeout tendency was pulled to see whether the matchup helped or hurt. What follows is the full reasoning, pitcher by pitcher, with the projection, the price, the break-even, and the matchup note that pushed each lean over the line.
The Card At A Glance
| Pitcher | Team | Prop | Odds | Units | Projection | Line |
|---|---|---|---|---|---|---|
| Braxton Ashcraft | PIT @ ATL | Over 5.5 K | -102 | 2.0 | 6.75 | 5.5 |
| Joe Ryan | MIN vs KC | Under 17.5 Outs | +124 | 2.0 | 16.23 | 17.5 |
| Tatsuya Imai | HOU vs OAK | Under 4.5 K | +118 | 1.5 | 4.00 | 4.5 |
| Kyle Bradish | BAL @ TOR | Under 17.5 Outs | -102 | 1.5 | 16.33 | 17.5 |
| Jack Leiter | TEX vs CLE | Over 5.5 K | +124 | 1.0 | 6.17 | 5.5 |
| Nolan McLean | NYM @ SD | Under 17.5 Outs | +102 | 1.0 | 16.58 | 17.5 |
Projection Versus Line, All Six Legs
The single best snapshot of a prop card is the gap between what the model projects and where the book set the number. The chart below plots each projection against its line. For strikeout props, a bar reaching above the line favors the over; for the unders, the projection sits below the line by design. The bigger the gap, the more the model likes the lean.
1. Braxton Ashcraft Over 5.5 Strikeouts (PIT at ATL), -102, 2 Units
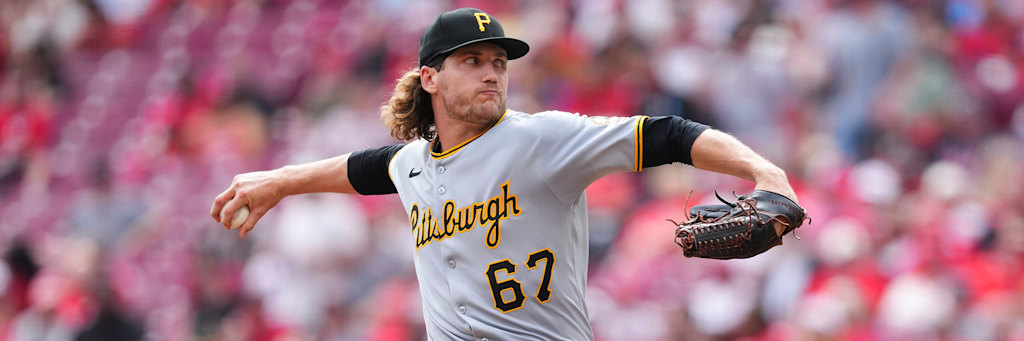
This is the headliner and it earns the two units. Braxton Ashcraft has quietly built one of the better quiet seasons in the National League: 12 starts, a 27.3 percent strikeout rate, and a 2.77 ERA across 74 and two-thirds innings. That is front-of-rotation production, and the strikeout total of 5.5 sits below where his volume usually lands. The model projects 6.75 strikeouts, more than a full punchout clear of the number, and at -102 the over is essentially a coin-flip price on a lean the model grades well north of 50 percent.
The form backs it. His last three turns produced 9 strikeouts in 7 innings against St. Louis, 5 against the Cubs, and 11 over 6 innings against Minnesota. When a pitcher punches out 11 and 9 in two of his last three, a line of 5.5 is asking him to underperform his own baseline. The matchup helps too. Atlanta sits at a 20.5 percent team strikeout rate, middle of the pack, and against a 27.3 percent arm that gap is where overs live. Ashcraft has to merely be himself to clear this. The over 5.5 at -102 is the strongest single number on the board.
The drag against him is the venue and the opponent quality: Atlanta can do damage, and a short outing on a bad day is the only realistic path to the under. But Ashcraft has gone at least six innings in each of his last three, so the workload is there. Take the over to -120 before the edge thins.
2. Joe Ryan Under 17.5 Outs (MIN vs KC), +124, 2 Units
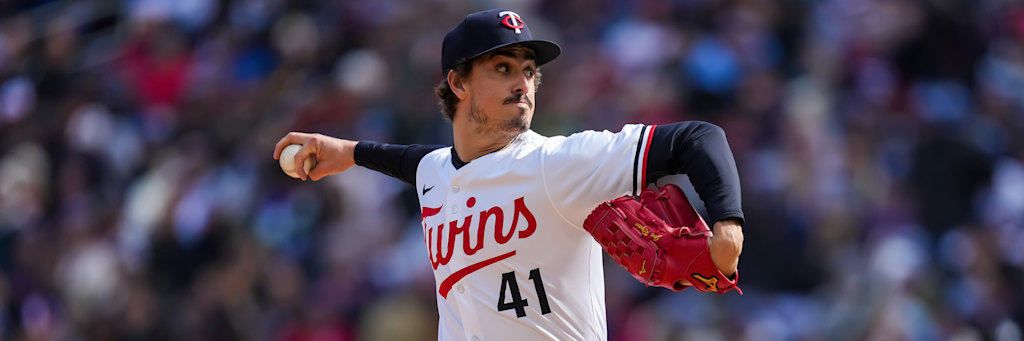
This is the value play of the card and the reason is pure pricing. Joe Ryan is a good pitcher with a 28.0 percent strikeout rate and a 3.20 ERA, but the outs line of 17.5 is asking for six full innings, and the model only sees 16.23. At +124 you are getting plus money on an under that grades better than the implied 44.6 percent break-even. That is the definition of a number with room.
Why under six? Ryan strikes hitters out, and strikeouts cost pitches. A 28 percent strikeout rate is a high-effort, high-pitch profile, and high-pitch starters get to their ceiling before they get deep. His recent line shows the volatility that makes the under live: 6 innings against Houston, 7 and two-thirds against the White Sox, then back to 6 innings on 8 hits in his last turn. Kansas City does not strike out much, a 21.4 percent team rate, which sounds bad for an outs under but actually helps it. A contact-oriented lineup that puts balls in play drives pitch counts and lengthens innings, and that pulls a strikeout pitcher early. Take the plus money down to +110.
3. Tatsuya Imai Under 4.5 Strikeouts (HOU vs OAK), +118, 1.5 Units
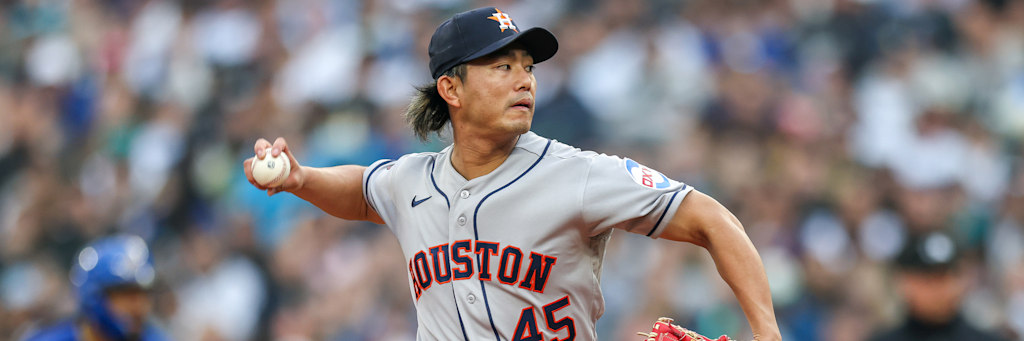
Tatsuya Imai is in his first MLB season with Houston and the book is still feeling out his strikeout volume. Seven starts in, the picture is clear enough for a lean: a 22.2 percent strikeout rate is below average for a starter, his 5.52 ERA reflects a pitcher working with traffic, and the model projects exactly 4.0 strikeouts, half a punchout under the 4.5 line. At +118 you get plus money on the under, well above the 45.9 percent break-even.
The recent log shows why the high-strikeout outcome is hard to count on. He fanned 5 over 4 and two-thirds against Minnesota, then just 2 over a clean 6 innings against Texas, then 5 against Milwaukee. A pitcher who punched out only 2 in a six-inning start two turns ago is not a lock for 5-plus. The opponent is the Athletics, a 22.1 percent team strikeout rate, which is roughly league average and not the kind of whiff-prone lineup that inflates a modest arm's punchout total. The under 4.5 at plus money is a clean 1.5-unit lean. Play it to even money.
4. Kyle Bradish Under 17.5 Outs (BAL at TOR), -102, 1.5 Units
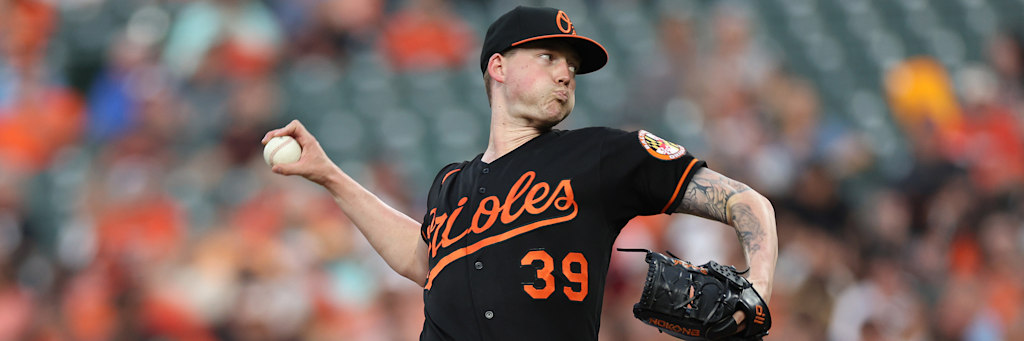
Kyle Bradish has pitched well in his return season, a 3.44 ERA over 12 starts, but the outs line of 17.5 is generous for a pitcher whose strikeout rate has settled at 23.1 percent and who draws a tough park environment in Toronto. The model projects 16.33 outs, more than a full inning short of the line, and at -102 you get a near coin-flip price on an under that grades comfortably ahead of it.
The matchup is the tell. Toronto carries the lowest team strikeout rate of any opponent on this card at 19.2 percent. A lineup that rarely strikes out makes a pitcher work for every out the hard way, on balls in play, and that drives pitch counts and shortens starts. Bradish has been efficient at times, a 7-inning shutout against Toronto on May 31, but his profile against a contact lineup more often produces a 5-and-two-thirds grind than a deep, tidy outing. Take the under at -102 or any plus number you can find.
5. Jack Leiter Over 5.5 Strikeouts (TEX vs CLE), +124, 1 Unit
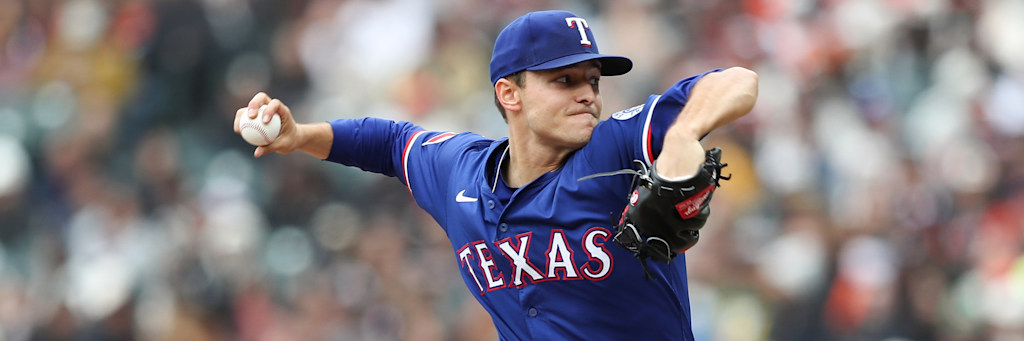
Plus money on a strikeout over is rare value when the underlying rate supports it, and it does here. Jack Leiter carries a 25.8 percent strikeout rate over 12 starts, and the model projects 6.17 strikeouts against a 5.5 line. At +124 the over needs only 44.6 percent to break even, and the projection grades it well above that. The ERA of 4.34 reflects some hard contact, but hard contact and strikeouts coexist all the time, and the bet here is on the punchout volume, not run prevention.
The most recent start is the loud one: 10 strikeouts over 5 and two-thirds against Kansas City on May 31. That is the kind of swing-and-miss outing that makes 5.5 look beatable, and Leiter has the raw stuff to repeat it. Cleveland sits at a 20.7 percent team strikeout rate, average enough that a 25.8 percent arm can clear 5.5 without needing a perfect day. This is a one-unit over because the ERA introduces start-to-start volatility, but the price is too good to pass. Take it to even money.
6. Nolan McLean Under 17.5 Outs (NYM at SD), +102, 1 Unit
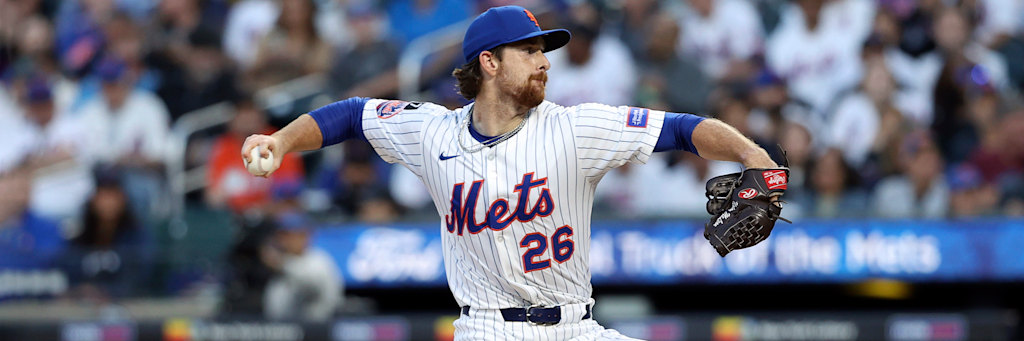
Nolan McLean throws hard and misses bats, a 27.9 percent strikeout rate, but the outs line of 17.5 is asking for length he has not consistently delivered. The model projects 16.58 outs, more than an inning short of the number, and at +102 you collect plus money on an under that grades ahead of its 49.5 percent break-even.
Recent form is the case. McLean's last three starts went 5 and two-thirds, then a short 3 and one-third on 7 earned runs against Cincinnati, then 5 innings against Miami. A pitcher who has cracked six innings just once in his last three turns is not a safe bet to go deep, and his high-strikeout, high-walk profile burns pitches fast. The wrinkle is the opponent: San Diego carries a 23.5 percent team strikeout rate, the highest on this card, which could let McLean rack up quick outs and stretch the start. That is the live risk and the reason this is a one-unit lean rather than a headliner. But on workload and recent form, the under 17.5 outs at plus money is worth the unit. Play it to -105.
The Price And Implied Probability Table
Every prop on this card is priced near a coin flip or on the plus side, which is by design. The model does not chase heavy favorites; it hunts numbers where the projection beats the break-even. The table below shows each price, the implied break-even win rate it demands, and the projection gap that pushed it onto the card.
| Pick | Odds | Implied Break-Even | Projection Gap vs Line |
|---|---|---|---|
| Ashcraft Over 5.5 K | -102 | 50.5% | +1.25 K above line |
| Joe Ryan Under 17.5 Outs | +124 | 44.6% | 1.27 outs below line |
| Imai Under 4.5 K | +118 | 45.9% | 0.50 K below line |
| Bradish Under 17.5 Outs | -102 | 50.5% | 1.17 outs below line |
| Leiter Over 5.5 K | +124 | 44.6% | +0.67 K above line |
| McLean Under 17.5 Outs | +102 | 49.5% | 0.92 outs below line |
The First-Inning Markets: A Full Pass And Why
Here is the part most pick services skip. The model ran all 15 first-inning NRFI and YRFI markets on the June 6 slate and graded every single one as negative expected value. Not one cleared. That means zero first-inning plays today, and we want you to know exactly why, because the passes are as much a part of the product as the bets.
The clearest example is the Dodgers game. The no-run-first-inning market was priced near -300, which demands a roughly 75 percent no-run probability just to break even. The model gave that first inning only a 40.7 percent chance of staying scoreless. When the book is asking you to lay 75 percent on something the model sees at 41 percent, that is not a thin pass, it is a wide one. The rest of the slate told the same story in smaller print: prices that demanded more certainty than the model could justify, on both the NRFI and YRFI sides.
This is the brand. We will publish a passing slate when the numbers say pass, and we will tell you the math behind it. Six pitcher props with real edges beat fifteen first-inning coin flips priced against you every time.
How To Bet The Card
- Anchor: Braxton Ashcraft over 5.5 strikeouts is the strongest single number, a 27.3 percent arm projected at 6.75 against a 5.5 line at a coin-flip price.
- Best price: Joe Ryan under 17.5 outs at +124 is the top value, plus money on a projection more than a full inning under the line.
- Stake the gaps: the two-unit legs carry the widest separation; the one-unit legs (Leiter, McLean) have live opponent risk and are sized down accordingly.
- Shop the lines: take Ashcraft to -120, Ryan to +110, Imai and Leiter to even money, Bradish to -110, McLean to -105 before the edges thin.
- First-inning: no plays. Do not manufacture a NRFI or YRFI bet today; every one graded negative.
Final Verdict
June 6 is a six-leg pitcher card built on the same idea every time: find the gap between the projection and the line, then make sure the price leaves room. Ashcraft and Leiter clear their strikeout overs on raw whiff rate, Ryan, Bradish and McLean stay under their outs lines on workload and matchup, and Imai's modest strikeout profile keeps him under a low number. Four of the six are plus money, the total exposure is nine units, and the first-inning board gets a clean and deliberate pass. That is the card.
FAQ
The tracked card is Braxton Ashcraft over 5.5 strikeouts at -102, Joe Ryan under 17.5 outs at +124, Tatsuya Imai under 4.5 strikeouts at +118, Kyle Bradish under 17.5 outs at -102, Jack Leiter over 5.5 strikeouts at +124, and Nolan McLean under 17.5 outs at +102, all from the FanDuel board.
Braxton Ashcraft over 5.5 strikeouts is the anchor at two units. He carries a 27.3 percent strikeout rate and a 2.77 ERA, and the model projects 6.75 strikeouts against Atlanta's 20.5 percent team strikeout rate at a near coin-flip price.
The model graded all 15 first-inning markets as negative expected value. The Dodgers NRFI, for example, was priced near -300 while the model gave the first inning only a 40.7 percent no-run probability, so every first-inning number was a pass.
An outs prop counts total outs recorded by the starter. The 17.5 line equals five and two-thirds innings, so an under is a bet that the pitcher fails to complete six full innings, whether through traffic, pitch count, or an early hook.